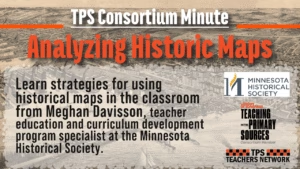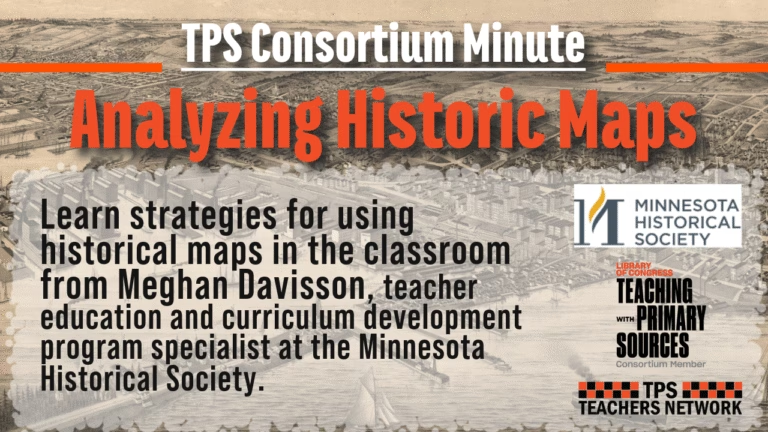
Learn how Meghan Davisson, educator and curriculum developer with the Minnesota Historical Society, shares strategies for using historical maps in the classroom.
The Minnesota Historical Society received a grant from the Library of Congress Teaching with Primary Sources program to create the Inquiry in the Upper Midwest project. This project delivered primary source based curriculum and professional learning for teachers.
Learn more about the Minnesota Historical Society.
Transcript
Maps are an exciting and engaging tool for students. They do more than show a location. They appeal to visual learners, and they tell stories, too. The Library of Congress holds over 58,000 digitized maps dating from 1136 to the present.
Today, I’m using a map of Duluth, Minnesota from the Library’s collection to practice the map analysis techniques.
A bird’s eye map shows a place from an aerial perspective, as if the map map maker was a bird looking out over a city or a landscape. In the 19th century, illustrations of cities from a bird’s eye view became very popular, showing an idyllic view of a city’s progress, peace and wealth.
Establishing Context
First, we’ll start with a common analysis tool: TODALSS. This acronym identifies the parts of the map:
- Title
- Orientation
- Date
- Author
- Legend
- Scale
- Source
Not every map will have all of these seven things, but students should always look for them as it establishes the context.
This map includes four of these elements: title, date, author, and legend. It is missing the orientation, scale, and source. Missing elements can also reveal information about the map. For example, bird’s eye view maps like this are typically not drawn to scale. The map makers also frequently charged businesses, churches, and individuals to include their buildings on the map.
What Story Does the Map Tell?
So we’ve established the context for the map. Now we can go deeper to understand the story. Have students examine the geographic details that are illustrated in the map using the five themes of geography, location, place, region, movement, and human environment interaction.
One amazing feature about the Library of Congress is that you can manipulate the map. You can move it around. You can zoom in very far. This helps us to read the entire map because frequently the labels, text and details are very small. Being able to zoom in really brings these alive and helps students to see those tiny details and find more evidence.
Location asks “Where is it?” Make connections between this map and Duluth’s actual location on Lake Superior. You can use the context map that is included here, or connect to someplace like Google Maps.
Place asks, “What is it like?” Have students describe the physical and human features shown on this map. They will likely notice the prominent water in the foreground with Duluth Harbor and Lake Superior, as well as the man made buildings, roads and docks.
Region asks, “How can this place be organized or grouped with other places?” Duluth is the westernmost point of the Great Lakes region. Show students another map with these lakes so they can understand the whole context.
Movement asks, “How and why do people travel, trade and share ideas across this place?” Students will likely notice the significant boat traffic on the lake. If they’re zooming in, they may also find the railroads connecting to the harbor.
Finally, human environment interaction asks, “How do people use, adapt to, or change the environment?” Look for connections between people and place. For example, students may be curious about what this area is like in the cold winter months. They may be wondering how people make money or what businesses they do. They can find some of that evidence within the map itself.
Local Connection
As students gather evidence from the map, help them to understand the local history surrounding it. Duluth is an important location in Minnesota, both historically and today. When iron ore mining developed in Minnesota’s Iron Range in the 1880s, Duluth became an important transportation hub. Railroads brought iron ore to Duluth, and barges shipped it across Lake Superior and the Great Lakes to Eastern factories to be processed into steel.
In 1893, the year this map was created, construction began on Duluth’s harbor. Giant ore loading docks were needed to hold iron ore until it could be loaded into ships.
By 1918, the harbor held six of these docks. You can see a few of them already in place in this map.
In 1905, Duluth’s iconic Aerial Bridge opened. You can see where it’s going to be located as you zoom in on the map and it is the entrance to the harbor. They connected Duluth and the rest of Minnesota with the world. Duluth flourished, becoming the third major city in Minnesota after Minneapolis and Saint Paul.
You can look for the details in the map as students understand this story. How does the history support or refute the evidence in the map and what questions are still unanswered? This is a great way to inspire curiosity about the world around them.
Can you find your community in the Library of Congress maps collection?